

 español
 English
 français
 Deutsch
 العربية
 中文
中文
RESUMEN Los operadores de redes de distribución enfrentan desafíos cada vez mayores relacionados con la Calidad de la Energía (PQ). EDP Distribuição en Portugal ha desarrollado un programa integral de seguimiento de PQ para abordar estos desafíos. Este documento describe la plataforma y la metodología de monitoreo de PQ de última generación utilizadas por EDP, y presenta los resultados del monitoreo de subestaciones HV/MV y MV/LV. También se discuten acciones de mejora en la red de distribución y soporte a clientes sensibles, destacando la integración de tecnologías avanzadas como los filtros activos de armónicos y los generadores estáticos de var de YT Electric para mejorar la PQ.
EDP Distribuição (EDP D) es una empresa del Grupo EDP Energias de Portugal. En Portugal, EDP D opera aproximadamente 83.000 km de líneas y cables de Alta Tensión (AT) y Media Tensión (MT), 400 subestaciones AT/MT y MT/MT y 62.000 transformadores utilizados para reducir la tensión a los usuarios de Baja Tensión (BT). con una capacidad de potencia total de unos 18.700 MVA (cifras referidas a finales de 2009), siendo el tamaño de la red de distribución de BT de unos 136.000 km. A finales de 2009, EDP D contaba con alrededor de 6,1 millones de clientes de la red de distribución.
Debido a las extensas zonas rurales del país, aproximadamente el 80% de la red de alta y media tensión es de tipo aéreo. Esto crea severas limitaciones en la Calidad de Servicio (QoS) en períodos de condiciones climáticas adversas, especialmente durante tormentas y sus consecuencias posteriores.
Como operador de la red de distribución portuguesa, plenamente comprometido con la prestación de un alto nivel de QoS, EDP D supervisa sistemáticamente sus redes, en particular las de nivel MT y BT, desde 2001.
Las campañas de monitoreo de PQ asociadas se han realizado de acuerdo con los estándares recomendados por la norma NP EN 50160 y también de acuerdo con un Código de Regulación de QoS nacional, que establece los diferentes indicadores y los correspondientes niveles mínimos de calidad que el Operador de Distribución debe garantizar a todos sus clientes en las diferentes tensiones. niveles.
EDP D ha estado desarrollando un programa integral de monitoreo de PQ para enfrentar todos los desafíos actuales. Este programa permite caracterizar la PQ en la red de distribución y en la entrada de clientes, y mejorar la operación y mantenimiento de la red de distribución, apoyar a los clientes y reportar la PQ a los reguladores.
Plataforma y Metodología de Monitoreo de PQ
Para lograr el objetivo de proporcionar los datos necesarios para realizar todos los análisis, se ha implementado una metodología que comprende la instalación de registradores PQ, infraestructuras de comunicación (recogida de datos), sistemas de almacenamiento y software de análisis. La topología básica de la plataforma de monitoreo PQ se muestra en la Figura 1.
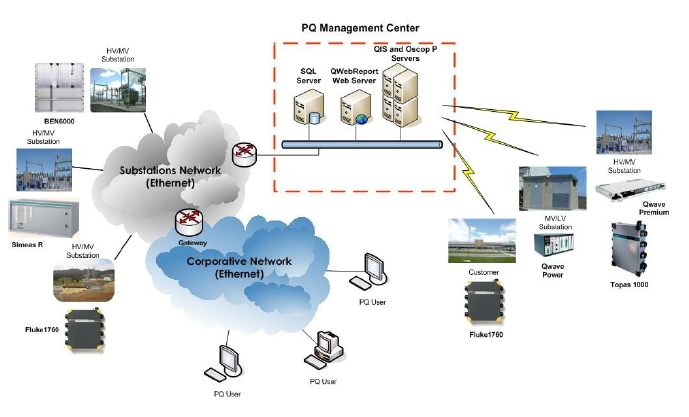
Figura 1. Plataforma de seguimiento de PQ de EDP.
The program is mainly based on 3 months PQ monitoring campaigns in HV/MV and MV/LV substations. These campaigns are performed to assure the requirements of the Portuguese QoS Regulation Code. Recently, EDP D has adopted a strategy of PQ continuous monitoring in all new HV/MV substations. In addition, PQ monitoring at some complaining customers is also carried out.
Systematic Monitoring Campaigns in Substations
Voltage measurements are performed in MV busbars of HV/MV substations, using about 26 portable PQ recorders per quarter. For MV/LV secondary substations there are performed measurements of voltage and current in about 42 LV busbars, per quarter, also with portable PQ recorders.
Continuous Monitoring in HV/MV Substations
According to the EDP D’ strategy to improve the PQ, since 2007 fixed PQ recorders with DFR features have been installed in all new HV/MV substations and in those submitted to a major refurbishment. So far, devices from Siemens (Simeas R) and Qualitrol (BEN 6000), with remote communications by Ethernet, modem and serial port, have been installed. Currently, the new acquisitions are only class A devices according to the IEC 61000-4-30 standard.
Customers Monitoring
Some customers are supported by point PQ monitoring in order to perform an accurate characterization of the PQ supplied and help identify improvement actions. Examples of these customers are sensitive industries and LV microgenerators. Typically, a portable class A PQ recorder is installed for monitoring during a month.
PQ Data Collection and Processing
For systematic monitoring campaigns in substations and customers monitoring, data are collected locally every month, and inserted in an SQL database. For continuous monitoring, the data are collected and stored automatically in the SQL database by scheduled actions.
After each quarter, PQ data of the systematic campaigns are processed in order to issue PQ overview reports to the Portuguese regulator. These reports are performed using a dedicated web based application (QWebReport). All PQ data are also submitted to analysis in order to support operation and maintenance.
PQ monitoring results from the HV/MV and MV/LV substations analyzed in the systematic campaigns during the quadriennium 2006-2009 are briefly presented.
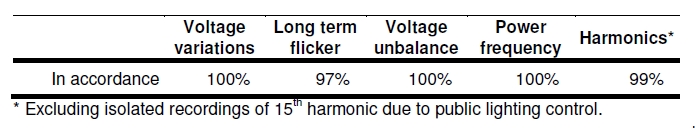
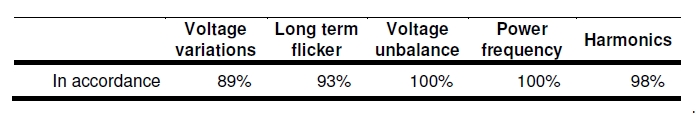
During the quadriennium, all the HV/MV substations were analyzed. In the Table 1 are presented PQ results (continuous phenomena) from the 539 MV busbars, in a total of 5819 monitoring weeks. These results are about the percentage of weeks in accordance to the NP EN 50160.
Table 1.
 .
.
The most part of flicker severity “not in accordance”, both in HV/MV and MV/LV substations, is associated to the occurrence of voltage dips.
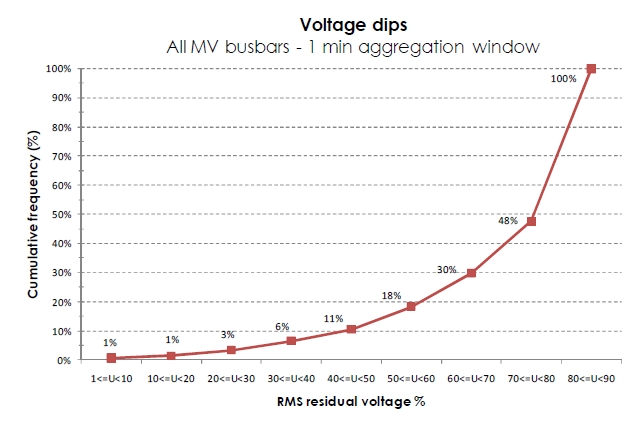
Figure 2. Voltage dips overview – Cumulative frequency.
In the Figure 2 is shown an overview of the voltage dips recorded in the same MV busbars. The voltage dips characterization was performed as defined in the Annex IV of the Portuguese QoS Regulation Code.
During the quadriennium, at least 2 MV/LV substations per municipality were analyzed. In the Table 2 are presented PQ results (continuous phenomena) from the 580 LV busbars, in a total of 5792 monitoring weeks. These results are about the percentage of weeks in accordance to the NP EN 50160.
Table 2.
Distribution Network
Voltage Variations The main PQ parameter “not in accordance” was voltage variations monitored at LV busbar of MV/LV substations. For the most part, there are situations associated to slight exceeded 110% of nominal value, in a short time. In some cases, situations were identified with origin in voltage regulation in upstream HV/MV substation or proximity of MV distributed generation.
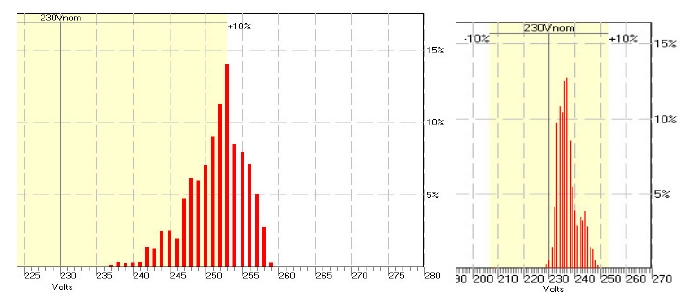
Figure 3. rms voltage values, before and after to decrease one point from tap changers.
Finally, some changes were performed on MV/LV transformer tap changers. For the case study presented in Figure 3, one notices that there were some recorded values slightly above the standard threshold.
After network analysis, the strategy to correct the rms voltage values was to decrease one point from tap changers, as shown in the same Figure. In sequence of the analysis, in some neighbouring MV/LV transformers the same change was made.
Flicker
The second case study is about the voltage flicker recorded in two MV busbars of a HV/MV substation. The substation topology is characterized by two transformers, one busbar for each transformer.
As shown in the Figure 4, the values of voltage flicker in busbar #2 significantly exceeded the limits defined in NP EN 50160.
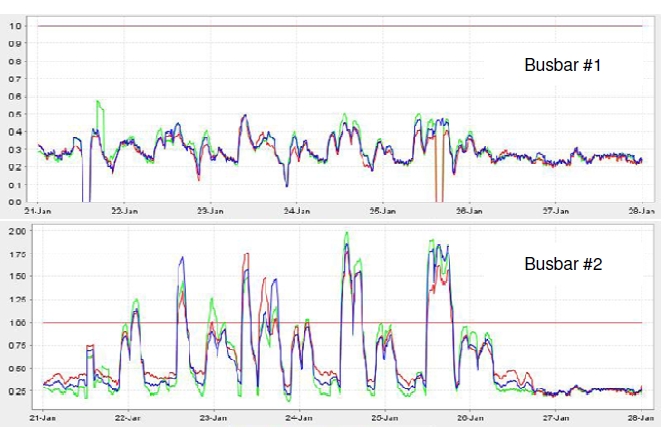
Figure 4. Voltage flicker (Plt) in busbars #1 and #2 (worst week) and the permissible limit.
In MV busbar #2 some customers were identified as potentially PQ polluters, including foundry (arc furnace), metal processing, recycling of scrap and stone industries.
The flicker level decreases with the increasing network short-circuit power. Therefore, a strategy to mitigate the voltage flicker, immediately and without any investment, was changing the busbar topology, namely, connecting the MV busbars. However, the advantages and disadvantages of this reconfiguration have been carefully studied.
This way we achieved an increase of 58% in short-circuit power in both MV busbars and approximately 16% in a foundry industry.
An additional monitoring in the HV/MV substation validated the procedures in order to mitigate voltage flicker throughout network, to regulatory values.
Harmonics
As a result of these systematic campaigns, EDP D has identified some problems in the distribution network, which deserve careful attention, namely those related to the 5th voltage harmonics levels at particular points along the MV and LV grids.
Resonance Harmonic:
The resonant harmonic hr, based on fundamental frequency impedances, is defined as follows [1]:
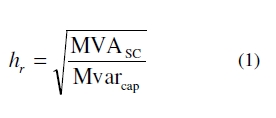
where hr = resonance harmonic
MVASC = system short-circuit MVA
Mvarcap = Mvar rating of capacitor bank
The resonant harmonic for the MV busbars of all HV/MV substations is calculated from the equation (1).
When the resonant harmonic is approximately close to the 5th harmonic voltage, studies are developed to prevent high voltage distortion based on the identification of potential resonance conditions in most probable network configurations.
In order to deal with the identified problems, to understand their main causes and, as much as possible, to foresee their solution, EDP D has been developing harmonic power-flow analysis models as well as harmonic state estimation models. These have been integrated into DPlan, an analysis and optimization program which evaluates and foresees future trends on harmonics phenomena in the grid, as well as their impact in PQ [2].
Once the non-linear loads have been estimated and the network has been characterized (for the selected frequencies), it is possible to simulate the harmonic behaviour of the system under topology and parameters changes. For example, it is possible to simulate the effect of switching-on capacitor banks, changing tap positions of transformers, connecting busbars and/or reconfiguring the HV or the MV network.
In a case study, the filter function “Harmonic voltage distortion” from a MV network was applied. It was concluded that the increase in the 5th harmonic in MV busbar #1 happens when the capacitor bank (CB) 1, connected to busbar #1, is switched on and the CB 2, connected to busbar #2, is switched off, coinciding still higher values of 5th harmonic with the periods in which the load is lower (off-peak hours). For another busbar, the conclusion is similar.
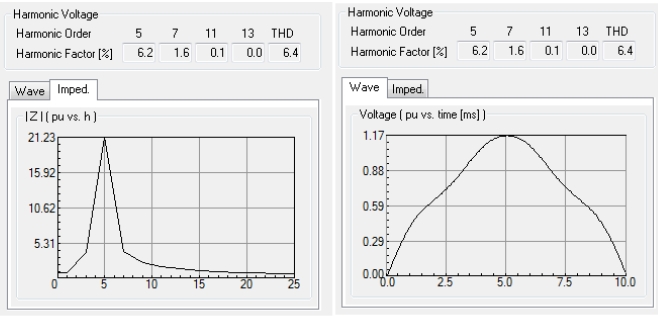
Figure 5. Harmonic voltage results in MV busbar #1.
The impedance curve depicted in the Figure 5 shows the resonance behaviour for the 5th harmonic.
The harmonic distortion problem was being caused by resonance created by the substation capacitor banks in the MV busbar. This resonance was magnifying the 5th harmonic component in the currents from all the customers on this system, causing high voltage distortion levels.
Optimizing the schedule of both CB, also associated to the management of reactive power in the network, reduces the 5th harmonic voltage to regulatory values.
Events
EDP D has been working on the reduction of the fault incidence on overhead networks in order to decrease the number and duration of voltage dips and short interruptions. Therefore, some actions have been considered, like preventive and predictive maintenance strategies, adjustment of the insulation level to the specific local conditions of the network and implementation of new overhead technologies, such as covered conductors. At the operation level, some actions have been also considered, like optimization of the protection systems, supply of sensitive customers by shorter circuits, from busbars with lower fault incidence or higher voltage levels, and increasing HV network robustness.
A pesar de los desafíos actuales, ha sido posible desarrollar un programa integral de monitoreo de PQ, que incluye varias semanas de monitoreo en más de mil barras de MT y BT. Además, se espera un aumento de los puntos de medición con los recientes desarrollos en la Plataforma de Monitoreo PQ de EDP, es decir, con la estrategia de monitoreo continuo en las subestaciones de AT/MT. A partir de los resultados del seguimiento de la PQ, EDP D ha adoptado varias medidas destinadas a desarrollar sus acciones en la red de distribución, como la mitigación de la distorsión armónica, principalmente el quinto armónico, la atenuación del parpadeo inducido por cargas industriales, la reducción de las averías en los sistemas aéreos. redes para disminuir la incidencia de huecos de tensión e interrupciones breves, así como el ajuste de los niveles de tensión en algunas barras de BT. Las campañas de seguimiento de la PQ también apoyan a los clientes sensibles que desean adoptar soluciones de inmunización y mejorar la fiabilidad de su producción.


 compatible con la red ipv6